

As a network professional, you rely on your FortiGate firewall to keep your network secure and running smoothly. But what happens when performance dips, or you see that unsettling “conserve mode activated” alert?
It can be frustrating when your critical security appliance isn’t performing as expected. You want a stable, high-performing network, and understanding these FortiGate behaviors is key to achieving it.
This guide is designed to help you quickly diagnose, understand, and address common FortiGate memory and performance challenges, ensuring your network stays protected and efficient. We’ll show you how to interpret key metrics and take actionable steps to optimize your FortiGate.
What is FortiGate Conserve Mode and Why Does It Matter to You?
Imagine your FortiGate as a highly efficient security guard. When its memory starts running low, it has a built-in “safety net” called conserve mode. This isn’t a failure; it’s a proactive measure designed to prevent crashes and keep your system stable, even under heavy load.
Here’s when it kicks in and what it means for your network:
- Trigger Point: Conserve mode activates when memory usage hits 88%.
- Critical Threshold: At 95% memory usage, your FortiGate starts dropping new sessions. This is where users will definitely notice an impact.
- Recovery: The system automatically exits conserve mode when memory usage drops below 82%.
Your Action: You can customize these thresholds to better suit your environment, giving you more control over your FortiGate’s behavior:
config system global
    set memory-use-threshold-extreme 95
    set memory-use-threshold-green 82
    set memory-use-threshold-red 88
end
The Silent Session Killer: Memory Tension Drops
Even before conserve mode, your FortiGate has another trick up its sleeve to manage memory: memory tension drops. If the system needs more memory and can’t allocate it, it will silently start dropping the oldest sessions to free up resources. This can impact active connections without a clear “conserve mode” alert.
How to Check: To see if memory tension drops are occurring, use this command:
BALANCED+ (global) #diag sys session stat
misc info:  session_count=75 setup_rate=3 exp_count=0 clash=0
     memory_tension_drop=0 ephemeral=0/126976 removeable=0 exteme_low_mem=0
     npu_session_count=21
     nturbo_session_count=21
delete=10, flush=13, dev_down=274/41 ses_walkers=0
TCP sessions:
     26 in ESTABLISHED state
     1 in TIME_WAIT state
firewall error stat:
error1=00000000
error2=00000000
error3=00000000
error4=00000000
tt=00000000
cont=00000000
Ips_recv-000947dd
policy_deny=001703c4
av_recv=00000000
fqdn_count=00000012
fqdn6_count=00000000
global: ses_limit=0 ses6_limit=0 rt_limit=0 rt6_limit=0
Look for the memory_tension_drop counter. A non-zero value here indicates sessions have been dropped due to memory pressure.
Is It Memory or CPU? Pinpointing Your FortiGate Performance Bottleneck
When your FortiGate is slow, the first question is often: Is it memory, CPU, or something else? Understanding how to quickly identify the root cause saves you valuable troubleshooting time.
Quick Diagnosis: Use this command to get a snapshot of your system’s performance:
get system performance status
BALANCED+ (global) # get system performance status
CPU states: 20% user 1% system 0% nice 79% idle 0% iowait 0% irq 0% softirq
CPU states: 11% user 1% system 0% nice 88% idle 0% iowait 0% irq 0% softirg
CPU1 states: 8% user 2% system 0% nice 90% idle 0% iowait 0% irq 0% softirq
CPU2 states: 15% user 0% system 0% nice 85% idle 0% iowait 0% irq 0% softirq
CPU3 states: 23% user 3% system 0% nice 74% idle 6% iowait 0% irq 0% softirq
CPU4 states: 33% user 4% system 0% nice 63% idle 0% iowait 0% irq 0% softirq
CPU5 states: 1% user 0% system 0% nice 99% idle 0% iowait 0% irq 0% softira
CPU6 states: 67% user 1% system 0% nice 32% idle 0% iowait 0% irq 0% softirq
CPU7 states: 4% user 0% system 0% nice 96% idle 0% iowait 0% irq 0% softira
Memory: 1964036k total, 1346896k used (68.6%), 369604k free (18.8%), 247536k freeable (12.6%)
Average network usage: 181 / 39 kbps in 1 minute, 216 / 63 kbps in 10 minutes, 229 / 71 kbps in 30 minutes
Maximal network usage: 413 / 340 kbps in 1 minute, 1456 / 1321 kbps in 10 minutes, 2505 / 2351 kbps in 30 minutes
Average sessions: 45 sessions in 1 minute, 45 sessions in 10 minutes, 44 sessions in 30
minutes
Maximal sessions: 80 sessions in 1 minute, 80 sessions in 10 minutes, 80 sessions in 30
minutes
Average session setup rate: e sessions per second in last 1 minute, e sessions per second in last 10 minutes, e sessions per second in last 30 minutes
Maximal session setup rate: 9 sessions per second in last 1 minute, 9 sessions per second in last 10 minutes, 9 sessions per second in last 30 minutes
Average NPU sessions: 7 sessions in last 1 minute, 8 sessions in last 10 minutes, 8 sessions in last 30 minutes
Maximal NPU sessions: 7 sessions in last 1 minute, 11 sessions in last 10 minutes, 11 sessions in last 30 minutes
Average Turbo sessions: 7 sessions in last 1 minute, 8 sessions in last 10 minutes, 8 sessions in last 30 minutes
Maximal Turbo sessions: 7 sessions in last 1 minute, 11 sessions in last 10 minutes, 11 sessions in last 30 minutes
Virus caught: e total in 1 minute
IPS attacks blocked: 0 total in 1 minute Uptime: 41 days, 5 hours, 18 minutes
This output provides crucial information on:
- CPU States: Helps you see if your CPU cores are overloaded (high “user” or “system” percentages, low “idle”).
- Memory Usage: Shows total, used, free, and freeable memory, along with the percentage used.
- Network Usage: Indicates current traffic load.
- Session Counts & Rates: Reveals how many active sessions your FortiGate is handling and the rate at which new sessions are being established.
Diving Deeper into Memory Usage:
FortiGate memory is categorized into several types:
- Kernel memory: Used by the operating system and drivers.
- Shared memory: Shared across processes, often for critical databases like IPS.
- User space: Memory consumed by individual running processes (e.g., httpsd).
- Cached memory: Used for disk caching to speed up operations.
- Slab memory: Pre-allocated memory for specific structures like sessions and NAT entries.
To investigate shared memory, use:
BALANCED+ (global) # diag hardware sysinfo shm

SHM FS total:
1379164168
1315 MB

SHM FS free:
1376931840
1313 MB

SHM FS avail:
1376931848
1313 MB

SHM FS alloc:
2232320
2 MB
For a more granular view of memory and process activity, these commands are invaluable:
diagnose sys top             // Real-time process monitoring (like 'top' in Linux)
diagnose hardware sysinfo memory // Detailed memory breakdown
diagnose hardware sysinfo slab   // Slab memory statistics
Managing FortiGate Processes: Taking Control (Carefully!)
Understanding process states can help you identify rogue processes consuming excessive resources.
Process States:
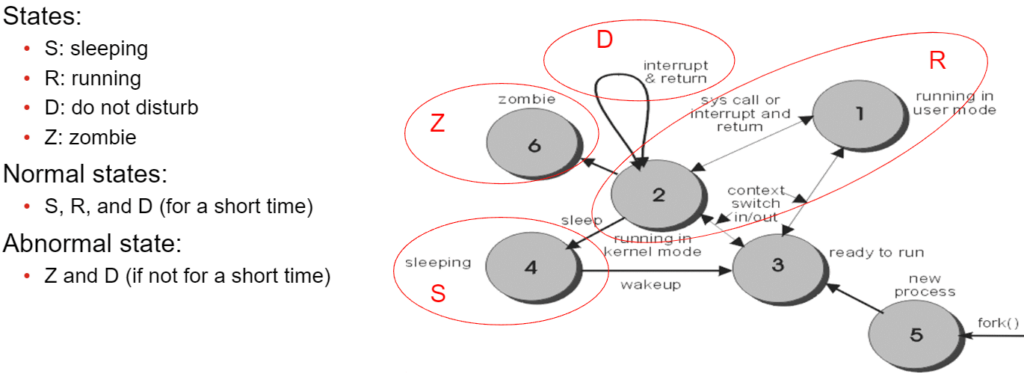
FortiGate processes can be in different states (like sleeping, running, etc.). You can see them with: fnsysctl ps
Important Note: Killing processes in a production environment should be done with extreme caution and only if you fully understand the implications. It can disrupt services. This is primarily for controlled test environments or under Fortinet TAC guidance.
If you need to kill a process (use with care!):
- Find the Process ID (PID):
diagnose sys process pidof httpsd // Replace ‘httpsd’ with the process name - Kill a Specific Process:
diagnose sys kill <signal> <PID>
FortiGate processes can be in different states (like sleeping, running, etc.). You can see them with: fnsysctl ps
If you’re in a test environment and want to experiment with killing a process (not recommended in production!), here’s how:
Find the process ID: diagnose sys process pidof httpsd
Kill a specific process: diagnose sys kill <signal> <PID>
Kill all processes with the same name: fnsysctl killall httpsd
Common termination signals:
- 4 – Illegal instruction
- 6 – Abort command from FortiOS
- 7 – Bus error
- 9 – Unconditional kill
- 11 – Invalid memory reference
- 14 – Alarm clock
- 15 – Graceful kill (recommended)
Boosting FortiGate Performance: Actionable Tips for You
Beyond troubleshooting, proactive optimization can prevent issues before they impact your network.
Common Performance-Heavy Features to Monitor:
- WAN Optimization: While beneficial, it can be resource-intensive.
- Threat Feeds: Continuous updates consume memory and CPU.
- Logging/Report Generation: Extensive logging can impact performance.
- Proxy-based Inspection: Deep packet inspection requires significant resources.
Tips to Boost Your FortiGate’s Performance:
- Tune Worker Processes: Adjust the number of worker processes to match your appliance’s capabilities and workload. Fortinet TAC can provide expert guidance here.
- Add More Memory (for VMs): If your FortiGate is a virtual machine, allocating more RAM can significantly improve performance.
- Utilize Hardware Acceleration (Physical Appliances): Ensure hardware acceleration features are enabled and properly configured on physical FortiGate appliances to offload tasks from the CPU.
Need Expert Assistance?
Navigating FortiGate performance optimization can be complex, especially with busy networks. If you’re looking to ensure your FortiGate is running at its absolute best, or if you’re facing persistent performance challenges, expert assistance can make all the difference.
BALANCED+ is a trusted Fortinet partner with deep expertise in performance tuning and optimization. We can help you analyze your specific environment, implement best practices, and ensure your FortiGate provides the robust security and performance your business demands.
Reach out to BALANCED+ today to discuss how we can help you achieve optimal FortiGate performance and keep your network running smoothly.